Far out in eastern Russia, deep in the Siberian Plateau, lies one of the great waterways of the world.
The Lena is the eleventh longest river on Earth. For thousands of treacherous kilometers, she makes her way through forests and across tundra, eventually delivering her waters into the icy cradle of the Arctic Ocean. The power of these frigid landscapes is such that for six months out of the year, the surface of the Lena is completely frozen.
The freeze starts with the deepening chill of October and extends through black December twilights and a solemn New Year.
Even when fresh springtime breezes arrive, melting the ice, the Lena pays a terrible price for her freedom. The sheets of ice do not yield peacefully, drop by drop, in a quiet surrender to the warmth. Instead, the process is rife with violence. As some parts of the ice destabilize, the flow of the river increases suddenly, and before the ice has a chance to melt, it sweeps downstream, displacing and spilling water over the banks and causing major flooding. This process is called “ice break-up.”
Very few people live along the vast plain where the Lena alternates between flow and ice. Near the Arctic Circle, a lonely station is the last shivering wisp of human life before the river dissolves into its northern grave.

Records made at this station over several decades indicate the precise date in spring when the Lena breaks free of her icy grip – the precise date when the ice crumbles and the entire river flows again. Over the past years, this date on which the ice breaks has crept earlier and earlier.
Thousands of miles away, in an office at UNC, sits Sarah Cooley. She has never been to Russia, nor seen the Lena with her own eyes, so she cannot tell you about its beauty, or ferocity, or chill. However, she has seen the Lena plenty through images. These are not images captured by a camera, but rather images captured by satellites, whose falcon-like eyes see much from their distant orbits. Can careful mastery and manipulation of these images tell us something about ice break-up on the Lena, something beyond the comprehension of a single station outpost?
It was August 2014, and Sarah was preparing to start her senior thesis. She wanted to focus on glaciers and satellites, so she went to find Dr. Tamlin Pavelsky, a professor in the geology department, whose earlier research focused on ice break-up in Arctic Rivers. However, Dr. Pavelsky completed his project in 2004, during the infancy of the newly-launched Terra and Aqua satellites. These satellites carry onboard quite a remarkable instrument called MODIS.
Although its name makes every aspiration at modesty, MODIS has much of which to be proud. Since 2000, the MODIS sensor has snapped images of the entire planet, every day. That means hundreds of thousands, if not millions, of images dedicated just to Arctic rivers like the Lena are available, free of charge, on a NASA website.
Now that MODIS is fifteen years old, her idea was to recreate Dr. Pavelsky’s project, incorporating the many extra years of data into the study. The first step required Sarah’s full familiarity with the NASA LAADS website, from which she had to download over 16,000 satellite images.
“It might be the most images anyone’s ever ordered before,” Sarah explains. The four Arctic Rivers she studied stretch out over 18 MODIS scenes. For each of those 18 scenes, Sarah downloaded 60 days’ worth of images over the fifteen years of MODIS’ existence. The sixty days were centered on March, April, and May, since that is the window in which the ice break-up occurs. Eighteen scenes on sixty days for fifteen years added up quickly!
It took Sarah three months to acquire her full library of images. The ordering process is not too difficult, “but then you have to wait for it, and when you get it, it’s not always what you expected, it might have errors, or wrong dates and be the wrong place.”
Nevertheless, after a Christmas break spent watching Sherlock and trying the utter patience of the NASA LAADS website, Sarah eventually was ready to proceed with her analysis of those thousands of images.
The thing to know about satellite images is that they are not precisely like the pictures we might snap, with ambitions of posting to Facebook and getting 100 likes.
A satellite image is a record of how much light is being reflected off the surface of the Earth – and not just the ordinary, commonplace lights like blue light, red light, and green light. Satellites also venture into the realms of light humans can’t see, such as near-infrared light, and short-wave infrared light, and all sorts. The falcon eyes of MODIS captures these wavelengths of light, then translates its findings into simple numbers that computers and brains can interpret and analyze.
Sarah was sitting on a trove of 16,000 MODIS images of near-infrared light. But can near-infrared light actually tell us anything about ice in Arctic rivers? This is where Sarah had to experiment.
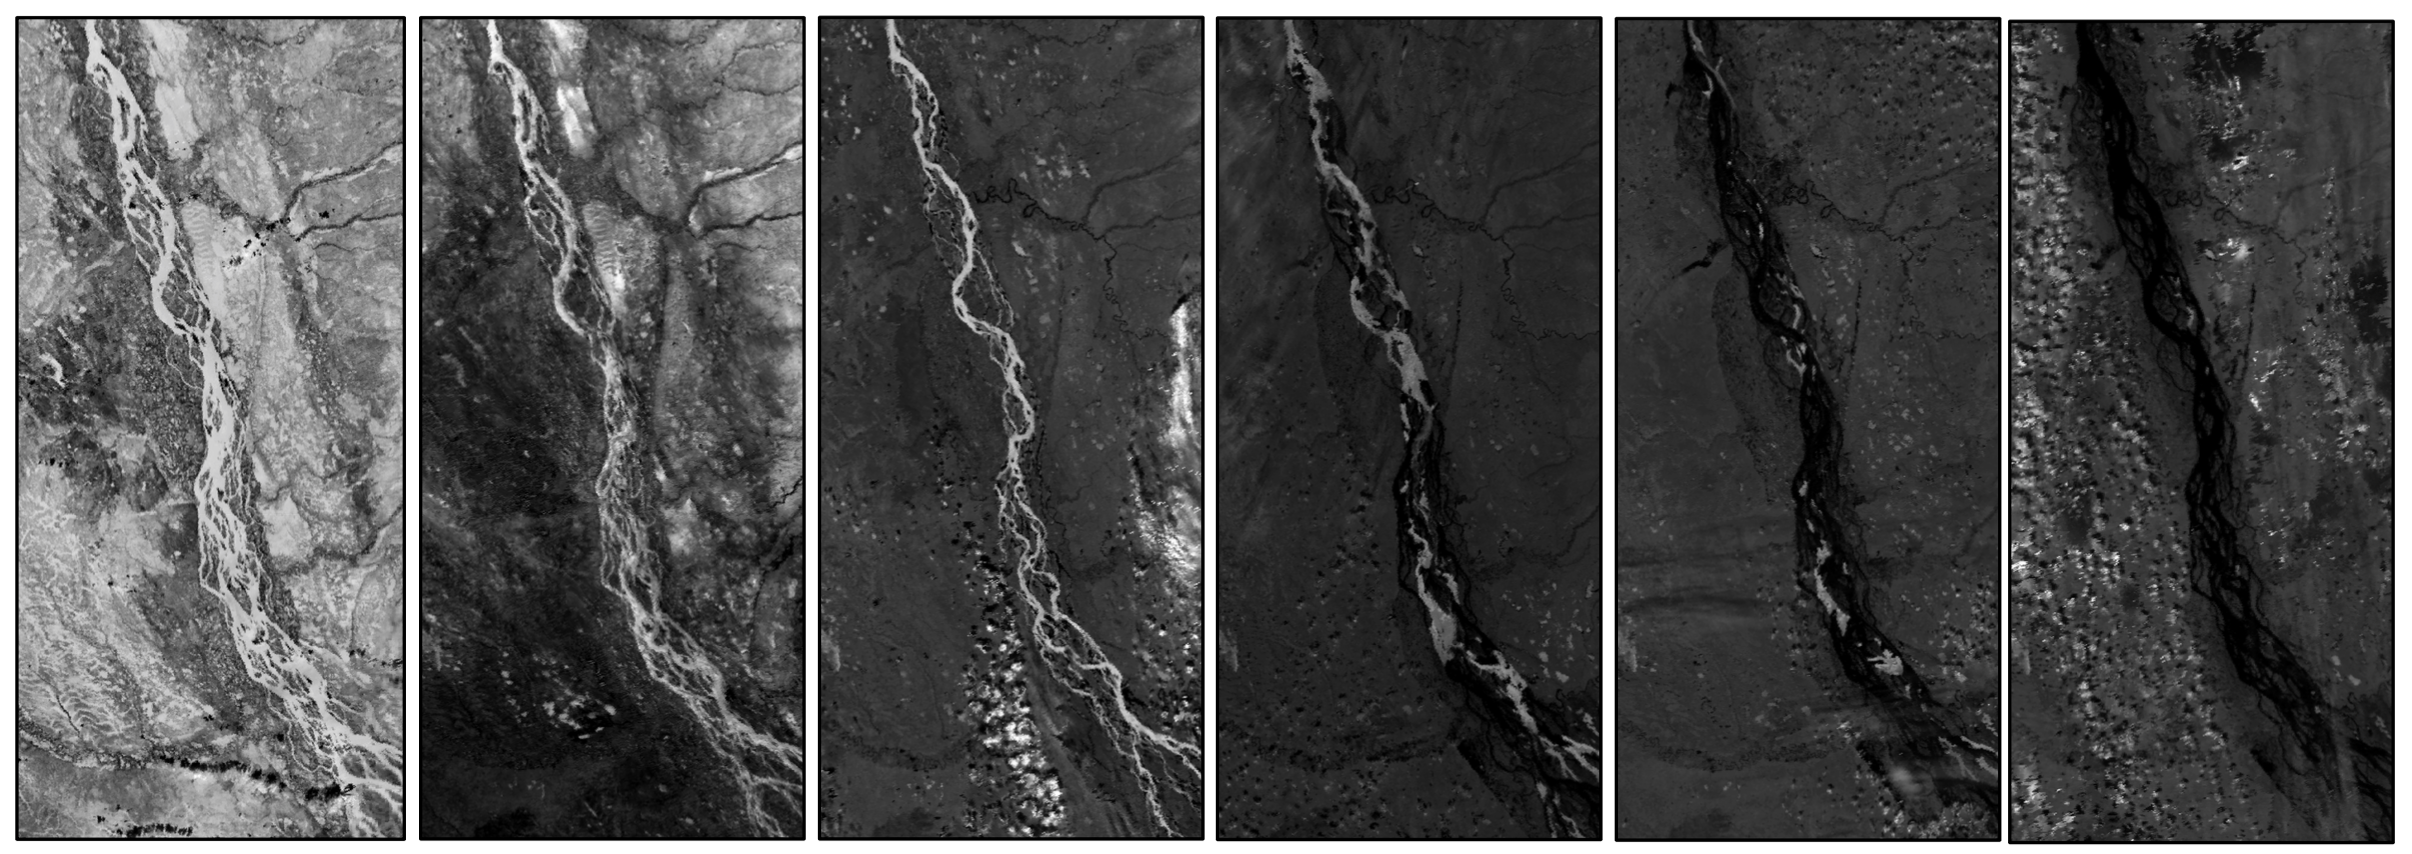
She found that when the Lena was frozen, it reflected almost all near-infrared light that reached it. On the other hand, when the river was an unshackled tumult of free-flowing water, its reflectance was very low. And when the river was a mix of ice and water, its reflectance value was somewhere in between.
Sitting in her warm office thousands of miles away, Sarah started watching the progression of ice break-up on the Lena by using near-infrared light as the key to unlock her satellite images.
With her reflectance data in hand, Sarah sliced her northern rivers into ten kilometer slabs. Then, like a child playing with its food, each slab was cut into impossibly tiny 250 meter pixels. For all her MODIS images, Sarah counted up which of her tiny pixels crossed the threshold that equaled ice; which lay in the range of water; and which belonged to the brew that denotes a mixture of ice and water.
On the day that 75% of the tiny pixels in a given slab passed the threshold that implies water, that slab was declared to have undergone its spring melting. This method finds the exact date that each slab of river melted, allowing detailed analysis of melting time on a year to year basis. It means that instead of a single date of ice break-up provided by a lonely station near the Arctic Circle, Sarah can now produce an estimate of when ice break-up is happening along the entire river.
It’s a very straightforward approach, and that’s one of the things Sarah likes about MODIS. “I really enjoy the simplicity, and it being daily is great. You can really do a lot with it.”
Of course, Sarah did not count all of the pixels and separate them into categories by hand. Instead, she wrote a series of computer scripts that did the work. The first part of her script classified the MODIS images into land, water, ice, and ice and water mixture. Then, all clouds were removed. Finally, computers calculated the amount of ice melt in each 10-kilometer slab. These scripts took three hours to run per river, much preferable to the hundreds of tedious hours it would take to do by hand. Now the scripts can be passed on and used by others, absorbing the newer images that MODIS keeps adding to its archives.
It is quite an achievement, especially compared to how Sarah felt when she first arrived at UNC as a freshman and saw older classmates doing sophisticated projects.
She remembers vividly thinking: “Oh my gosh, I can never do that. Now I realize I can do so many more things than I ever thought I could. And I realize that learning all those things isn’t something that happens overnight, it’s something you learn by taking classes, doing research, working in the lab. And now I’m never intimidated by coding. I love coding and seeing the things I can do with it.”
We are now in the waning days of April, and Sarah will soon graduate from UNC Chapel Hill. She and Dr. Pavelsky are finalizing a paper on their results.
After UNC, Sarah is moving to England to complete a Masters of Philosophy degree in Polar Studies at Cambridge University as a Gates Cambridge Scholar. Showing a persistent interest in Arctic ice, she plans to focus on glacier flow in Greenland.
Sarah fell in love with Greenland and wanted to pursue polar science ever since she studied abroad in Denmark and visited the Greenland ice sheet. “It’s really cool being out there, and there’s people, wildlife. Some people like to study polar science in Antarctica, but to me, it seems so empty. I like how in the Arctic everything feels connected to the people and the land.”
Meanwhile, the Lena still succumbs to the bleak icy thrall that envelops her every October, from which she cannot relax until the spring ice break-up, which every year creeps earlier in the calendar. Signs of climate change are everywhere.
Will the river change its melting patterns? Will its ice break-up involve more flooding in the future, or will it occur in irregular patches that do not progress linearly down its Siberian route? All of these are questions that satellites, ground station data, and scientists like Sarah can help to answer.
Peer edited by Chris Givens and Chelsea Boyd.
Follow us on social media and never miss an article: