New discoveries in astronomy often make the news. But extracting meaningful information using only light from distant stars can be very difficult, and astronomers do occasionally get it wrong. What does it mean when that happens, and how can astronomers check their work?
Last fall, Dr. Jane Greaves and her 18 co-authors made an exciting announcement— they had detected phosphine in the clouds of Venus. A phosphine molecule is a combination of one phosphorus atom and three hydrogens, which should not be able to survive for long in the highly acidic upper atmosphere of Venus. The article, which was published in Nature, received a lot of attention both from popular science and news outlets and from other astronomers. The presence of this chemical, if confirmed, raises exciting questions about what we don’t know about in Venus’s atmosphere. It would mean that an unknown chemical reaction is consistently producing phosphine there. Some have speculated that this reaction may even come from a biological source.
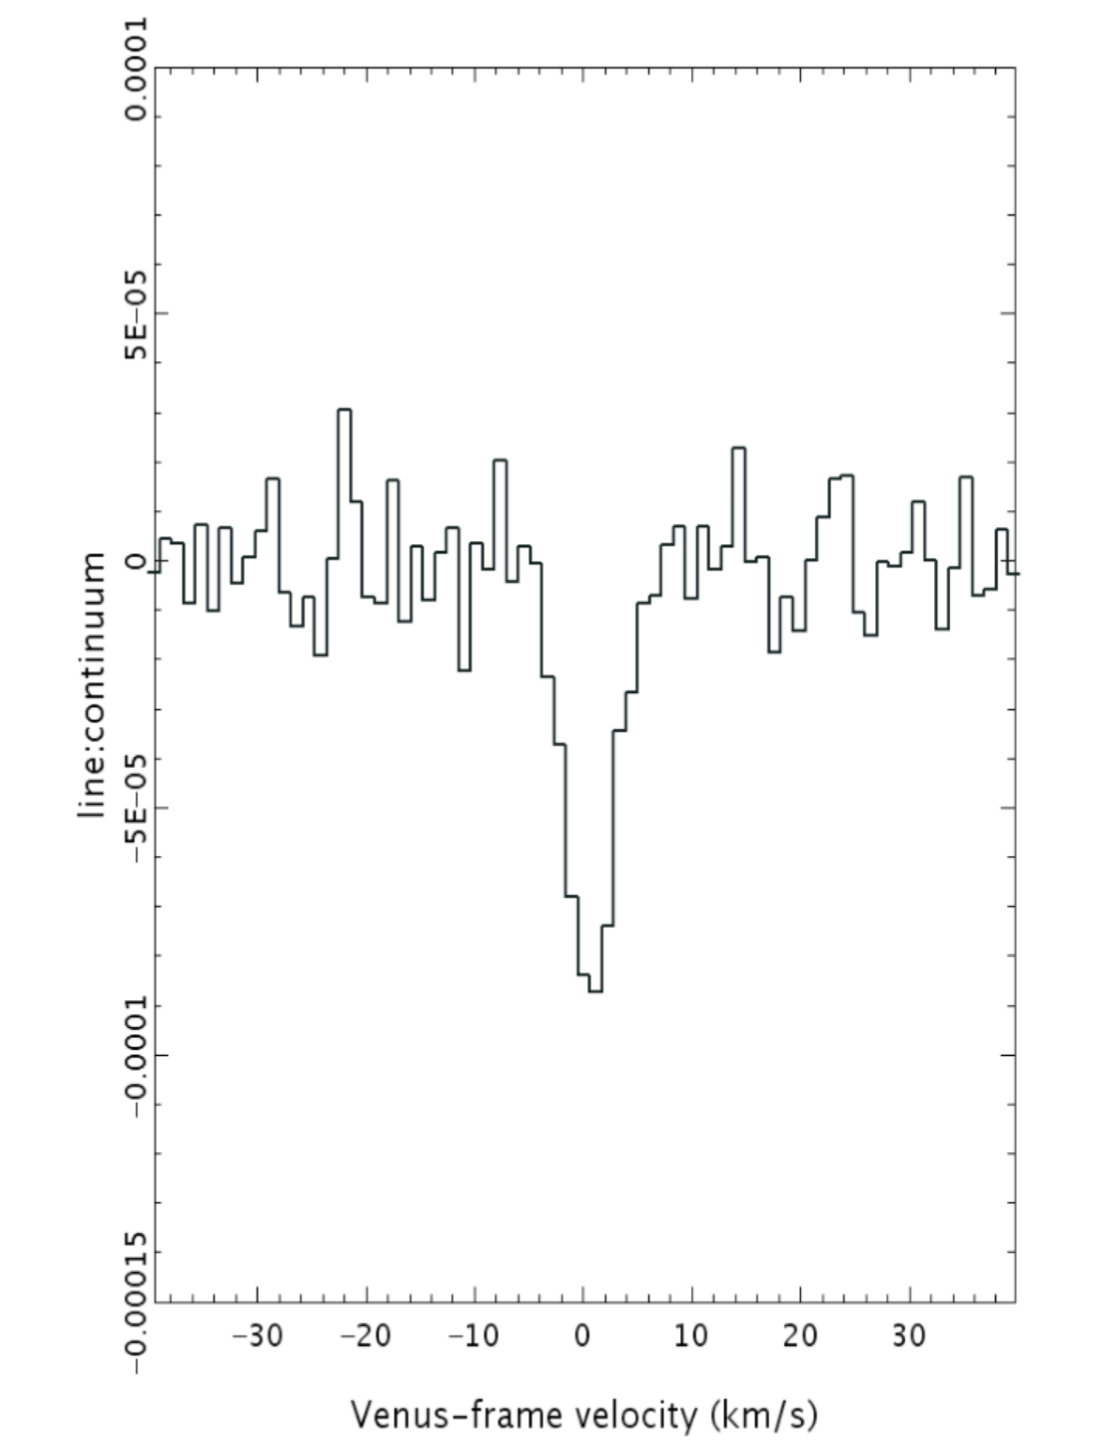
The discovery was made using spectra of Venus’s atmosphere collected with two different telescopes, the Maxwell telescope and the ALMA telescope array. A spectrum is a type of dataset often used in astronomy. It gives information about the intensity of light at various wavelengths, and can be used to determine what chemicals are present in a sample. Since all molecules have individual spectral “fingerprints”, the changes in intensity at specific wavelengths can be matched to the chemicals that cause them, to calculate the species and amounts of molecules present. By detecting a dip in the spectra at the wavelength where phosphine is expected to absorb light, the authors determined that it was likely present in the upper atmosphere.
However, other astronomers soon raised a number of doubts about the validity of the study. The operators of one of the telescopes the authors used found an error in the code used to process the data, and subsequently retracted it until reprocessing was complete. The results using data from the other telescope were also called into question, as other researchers found that the alleged phosphine signal was artificially amplified by the analysis method used by the authors. They showed that false signals could be created in similar data by using the same method as used in the phosphine detection.
How can we know that we are right?
The method used in this paper is part of the backbone of astronomy. The use of spectra to determine what molecules are present, and in what amount, can answer questions ranging from differentiating between types of stars, to measuring their ages, to identifying the chemical composition of the early universe. If astronomers can get it wrong when using this ubiquitous method on something as groundbreaking as this research, how can we ever know that we’ve done it right?
As a first check, there are a number of scientific guidelines that can be followed.
Any astronomical detection—of molecules in an atmosphere, of a planet, of a black hole—needs a measurement of its statistical significance to determine how likely it is to be correct. Significance is roughly a measure of how likely or unlikely you would be to get that measurement as a false positive, and should be used as a first check to make sure you’re right. Many astronomers today require a 5𝝈, or 99.9999+% significance, and if a discovery does not meet that criterion, you should consider revisiting the analysis or collecting more data. However, significance alone does not guarantee an accurate result, especially considering the many layers of processing and analysis which are often applied to astronomical data to extract results.
One type of processing that data may undergo is a fitting process. Fitting data is a way of matching your measured data (and errors) to an analytical function that can describe them. It is an extremely useful method, and is often used in astronomy to find the underlying distribution of data with noise in it. This was used in the original phosphine study to remove the excess noise and isolate the phosphine signal. A common danger of this method is over-fitting, in which rather than finding the underlying signal and removing the noise, the noise is included in the analysis, creating a more complicated model than can be justified by the data. In the case of the phosphine detection, the authors used a twelfth order polynomial to fit the data. Over-fitting can lead to removing real signals from data, or to adding ones that aren’t there.

There’s no one way to interpret astronomical data. There are many different methods that might be used in even the most common types of analysis, depending on the type of data, the telescope it was taken from, and a number of other factors. Different methods can be expected to produce results that are slightly different, but shouldn’t completely change the conclusion. Another way astronomers test their results is to try a few different methods and make sure that the results are consistent and reproducible. Recently, this practice was used while examining the first discovery of a candidate exomoon — a moon orbiting a planet outside our solar system. The authors found a dip in the light curve of a planet as it crossed near its star, suggesting that they were seeing something orbiting the planet itself. However, other astronomers suggested that the signal was a false positive, as they did not find evidence for the exomoon using a different data analysis method.
These methods and many more are good ways to test an astronomical result, but as with all of science, the best way is to get opinions from other astronomers. After all, science is the collective effort to determine what is true and what is not about the universe. It’s important to remember that any scientific article is not a declaration of a newfound fact, but a statement that “This is what I found. What do you think?”
Peer edited by Melody Kessler and Rachel Ernstroff
This is really informative and I think the last paragraph is particularly impactful! It’s important to remember that science is ever changing based on new data and interpretations and that we are all just trying to make the most sense of the world we live in 🙂