March Madness isn’t just a time for basketball lovers. March Madness is also an unspoken celebration of science, technology, engineering and mathematics (STEM). For 18 days, the nation is captivated by college basketball, bracketology, and the unpredictability of high-level competition.
What is the madness of the Big Dance?
March Madness, commonly referred to as the Big Dance, is the annual National Collegiate Athletic Association (NCAA) Division I Basketball National Championship featuring 68 competitive teams participating in a single elimination tournament throughout the end of March. Starting in the second to last week of March, 63 basketball games are played over an 18 day period in 6 rounds (excluding the First Four games). Historically trademarked as only the Men’s Tournament, the NCAA’s March Madness marketing and branding recently expanded to include the Women’s Tournament in 2022 following the recommendation of the NCAA’s commissioned Gender Equity Report released on August 3rd, 2021.
Each basketball team must earn a bid to compete in the tournament either as an automatic qualifier or by invitation. Each of the 32 NCAA DI conferences are granted an automatic bid, which is given to the team that wins their conference tournament regardless of team play during the regular season. For instance, this year the Atlantic Coast Conference (ACC) awarded its automatic bid to NC State (North Carolina State University) with a regular season record of 22-14 following their 84-76 victory over North Carolina (UNC Chapel Hill), the regular season ACC Champions with a record of 27-7.
The remainder of the 36 teams are invited to play in the tournament with an at-large bid. The NCAA Selection Committee meets after all regular season and conference tournament games are concluded to decide which teams will be invited to the tournament based on their season pedigree, a compilation of statistics and different rankings such as Quadrant wins. The selection process includes a complex ranking model called the NCAA Evaluation Tool or NET which combines statistical modeling to rank the teams strength during regular season play, the quality of each win, and how each team played offensively and defensively in each game. At-large bids are awarded to teams that impressed the committee with no limit on the number of teams selected from a conference. This year ten conferences were given multiple bids with both the Big 12 and Southeastern Conference (SEC) granted 8 teams.
Creating the perfect bracket is a cultural phenomenon.
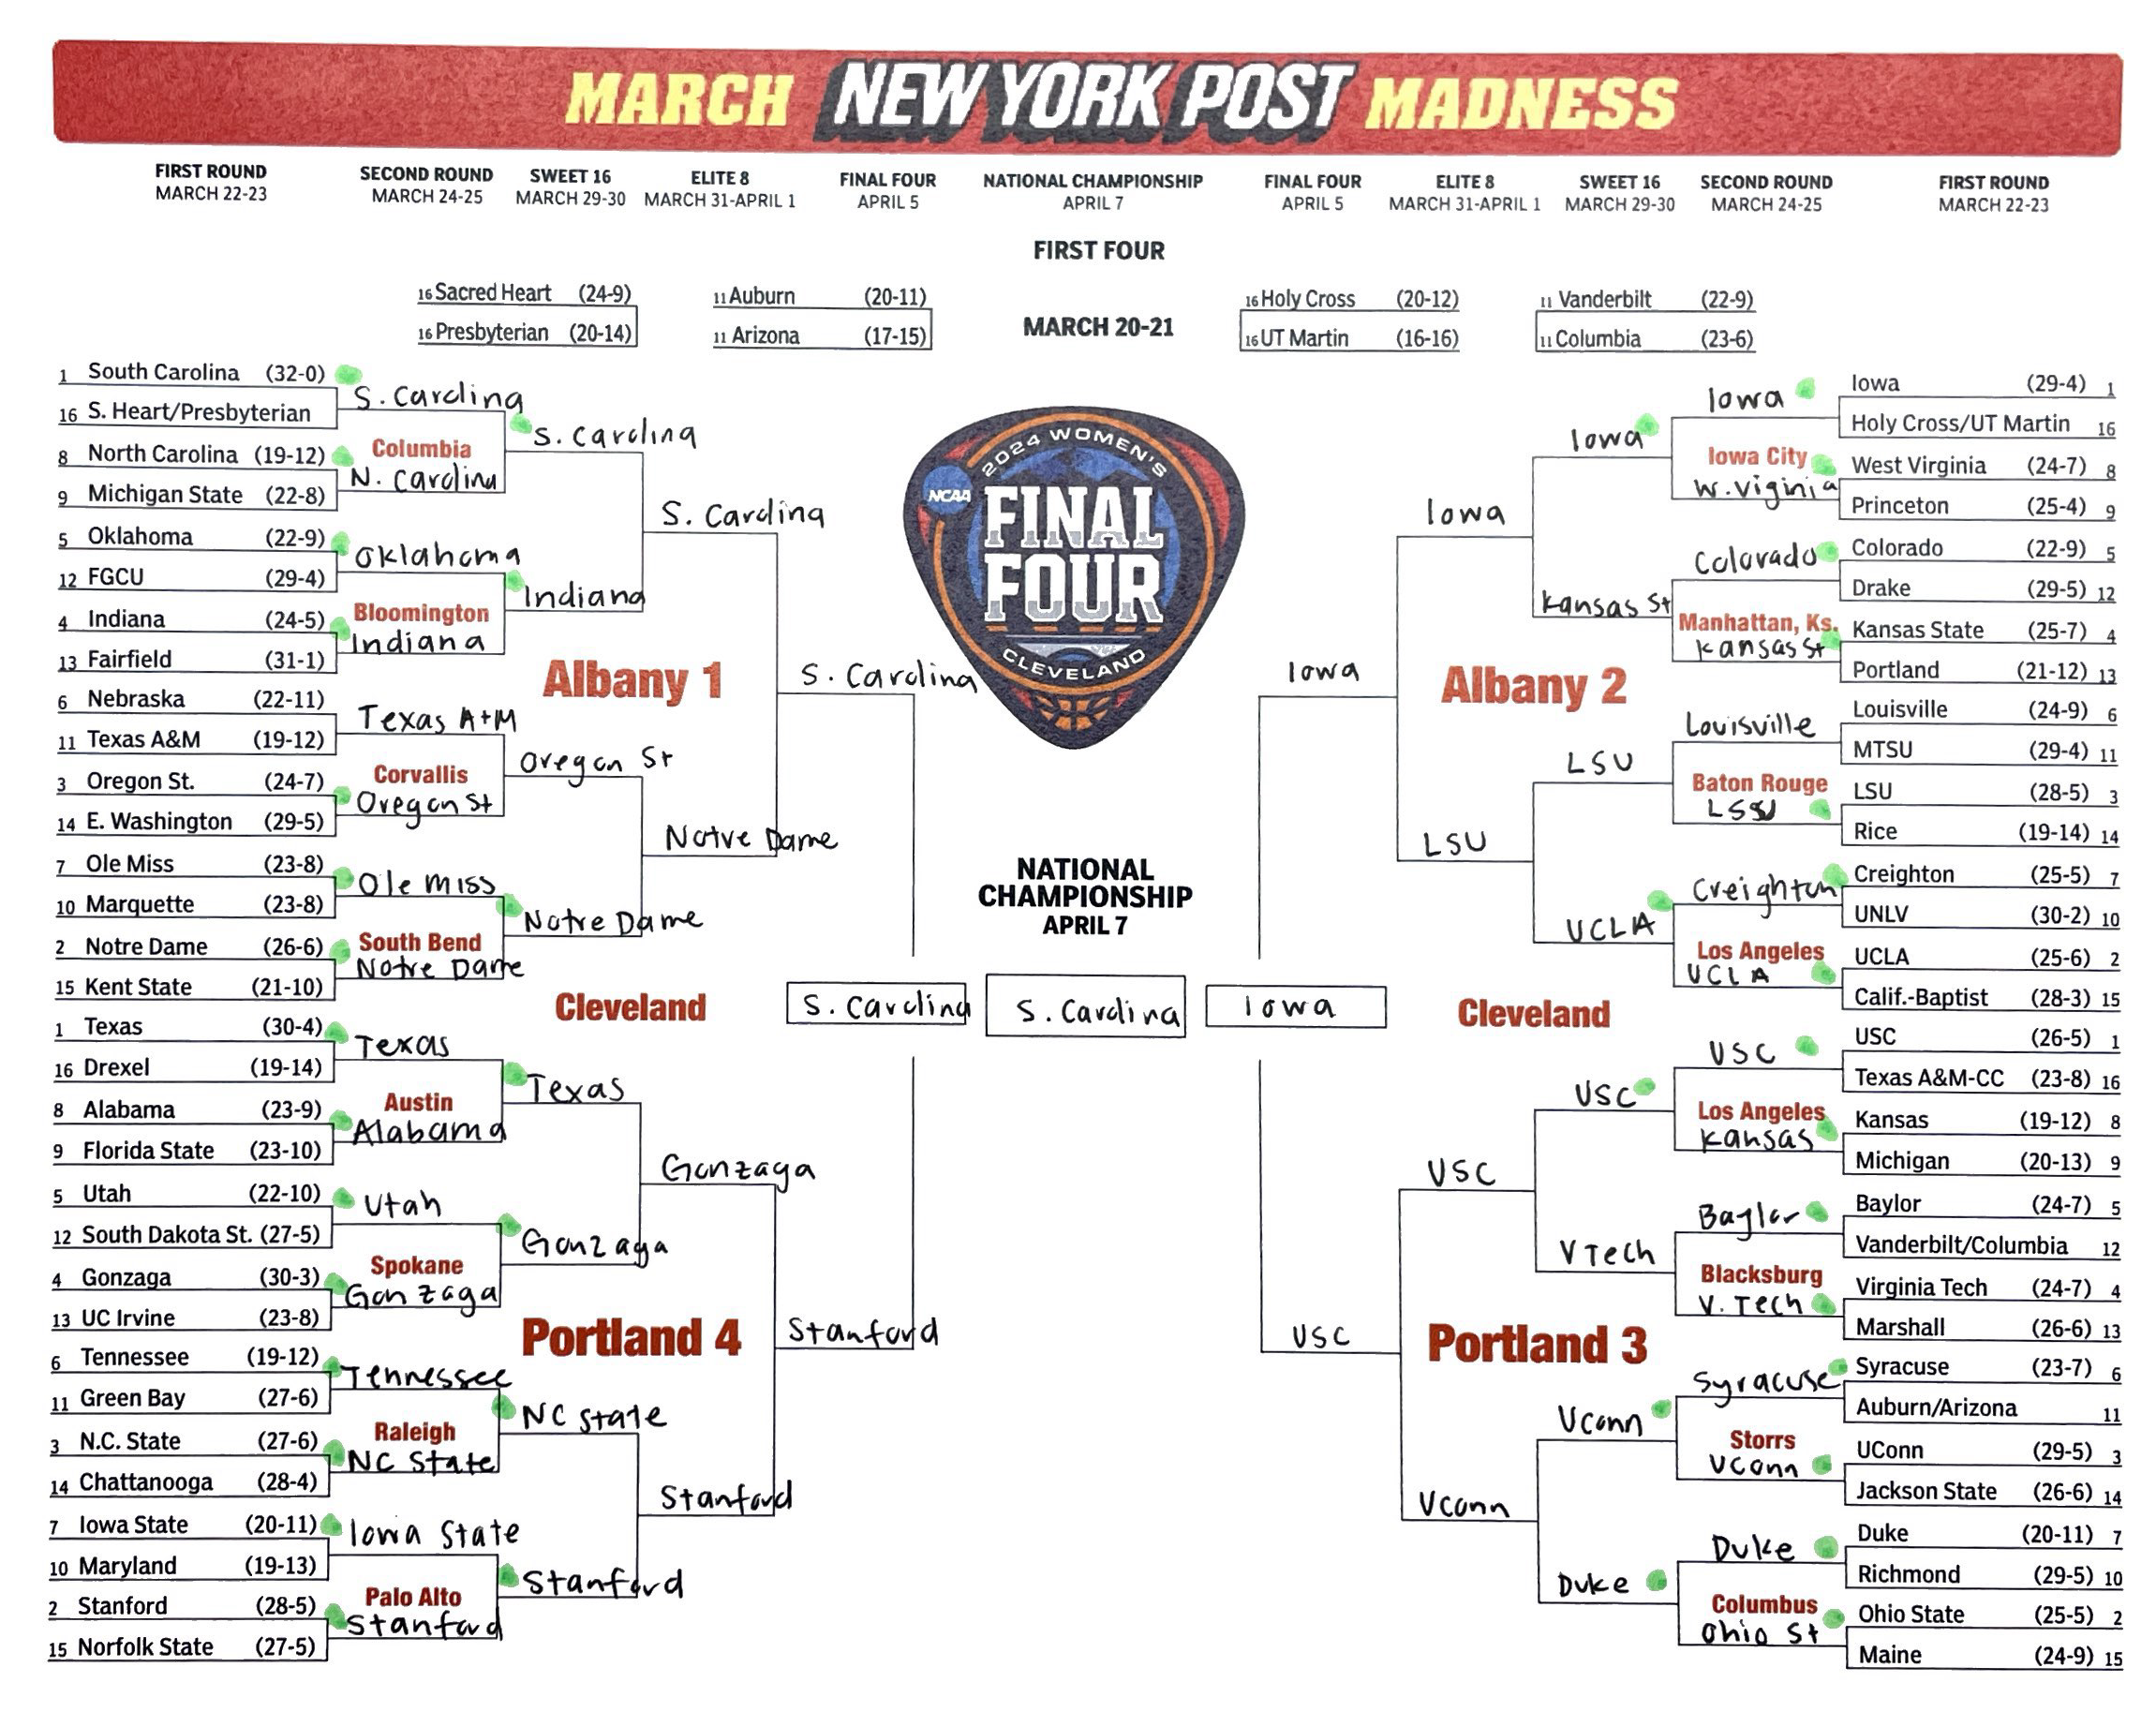
The tournament itself is a single elimination bracket. A win is an advance up the bracket. A loss sends you home. Prior to the start of the tournament, fans partake in one of the most anticipated traditions in American sports: filling out the perfect bracket. Every year between 60 to 100 million brackets are filled out and the quest for the perfect bracket begins.

A perfect bracket would correctly select the winner of all 63 games played in the tournament, which has the odds of 1 in 9.2 quintillion according to the NCAA. No one has ever picked a perfect bracket, but that doesn’t mean it’s impossible. In 2019 Gregg Nigl of Columbus Ohio correctly predicted the first 49 games of the Men’s Tournament until No.3 Purdue defeated No. 2 Tennessee in the Sweet 16. Adding to the excitement, the NCAA maintains a live bracket throughout the tournament for the men (DI MBB) and women (DI WBB).
Bracketology combines multiple aspects of STEM.
STEM disciplines are a key participant in bracketology, or the practice of picking the outcome of an elimination tournament. Given the cultural phenomenon of creating the perfect March Madness bracket, bracketology is most often associated with basketball. Statistics is the very cornerstone of bracketology. Considering team records, player statistics, and historical tournament play all help bracketologists identify trends to inform their bracket creation. Bracketologosts often base the odds of teams advancing to each round by their initial bracket seed. The probability of upsets between different seeded teams are also used to guide bracket creation. The tournament averages 8.5 upsets each year, where most upsets occur in the first round between a No. 11 seed and a No. 6 seed (38% chance of an upset). While it’s highly improbable that a No. 16 seed beats a No. 1 seed in the first round, with the odds at 2 to 154 (less than 1% with relative frequency probability modeling), in 2018 No. 16 University of Maryland, Baltimore County upset No. 1 Virginia and in 2023 No 16. Farleigh Dickenson upset No. 1 Purdue.

Historical tournament data also guides bracketology. For instance, a double digit seed has never made it to the championship game. A No. 8 seed is the lowest seed to ever win the tournament with Villanova in 1985 and No. 8 seed teams have only made it to the championship three other times: Butler in 2011, Kentucky in 2014, and North Carolina in 2022. The probability of an upset can also be guided by historical play. According to historical data, at least one No. 2 seed should be picked to lose in the second round as a No. 7 and No. 10 seeds have upset a No. 2 seed at least once in the second round in the past 38 tournaments.
When comparing two teams facing off, bracketologists often consider factors beyond seed. Team style (fast paced versus slow paced game play), team weaknesses (such as poor three-point shooting), and recent performances all guide bracketologists. Many bracketologists take into account the Pomeroy College basketball rankings, commonly known as KenPom. Independent of the NCAA, Ken Pomeroy developed an advanced statistical model to rank each team by adjusted efficiency margin, which is the adjusted offensive efficiency minus adjusted defensive efficiency. These metrics blend together game pace with offensive and defensive strengths and weaknesses. Based on the last 15 NCAA tournaments, there is over a 90% chance a top 20 team on the adjusted efficiency margin makes it to the Final Four and wins the tournament.
Advancements in technology, creation of new algorithms, and the development of machine learning, and tournament simulations have helped improve brackets. Machine learning algorithms are often trained with data from KenPom due to the range of team metrics and in-game statistics. While these algorithms have yet to pick a perfect bracket, they do give realistic tournament champions and pick out teams who are not consistent enough to deep runs. In the last few years, several data scientists and statisticians have participated in Machine Learning Madness, a competition hosted on Kaggle, where participants can leverage machine learning techniques to create more successful tournament brackets. In these machine learning competitions, it’s more important to understand mathematical modeling and neural network training than basketball. Competitors in Machine Learning Madness use a wide range of platforms (R, Python, etc) and mathematical models to estimate the likelihood of a specific matchup and outcome based on both tournament data and current team statistics. Machine Learning Madness is a testament of statistical informatics and engineering power, where historical tournament data is blended with computing power to design bracket predictions. Notably, those who compete in Machine Learning Madness must design brackets and submit code for both the Men and Women’s tournament.
Although science, technology, engineering, and mathematics can all be blended together for optimizing bracket success, no method of integration will truly model a basketball game. Braketologists must balance data analytics skills with intuition. No mathematical model can predict the human experience, not even Artificial Intelligence. Random acts such as the stress of travel, unforeseen injury, and the high stakes weighing on student athletes make the tournament incredibly challenging to predict. Even though advanced learning machine algorithms with predictive analytics can identify potential upsets, few models accurately identify Cinderella teams, low-seed teams who make a deep run in the tournament. While the perfect bracket is likely to remain elusive, leveraging statistical modeling and data analytics can significantly improve bracket success.
March Madness is more than a college team’s quest for a championship.
March Madness isn’t just a collegiate basketball tournament, it’s a celebration of STEM in sports analytics. This tournament is a journey of analyzing data and making predictions as to which teams will go far and which teams will defy the odds. In these two and a half weeks, the nation will witness unforeseen upsets, early exits, and thrilling finishes all while engaging with the power of statistics and STEM.
Peer Editor: Kim Taylor